Monday 27 May 2019

Balcony Project Week 3

This "weeks" progress has been concerned with the finer details in the steels. especially the staircase. The tricky piece has been to ensure that there is sufficient head clearance at the lower end of the staircase to satisfy building regs. Keeping within the outline of the balcony has forced some rework to use a double turn staircase.


Also arriving this week were some samples for the decking and support materials. In order to have better durability we have chosen to use plastic lumber for the decking substructure from Envirobuild.


This new material is made from recycled plastic waste and can be worked with wood working tools and methods. Having got some 3M samples of 3*1 the feel of the lumber does seem to be a bit different than wood possibly not having quite the same torsional rigidity. This will be fine for the decking support but not sure would work for the main support joists.

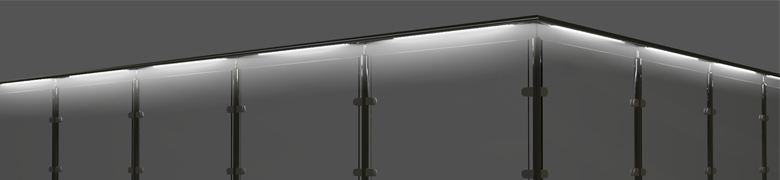
Looking further on to the finishing touches we are considering an illuminated handrail which will certainly add some glamour and price.  Something like this picture.


Illumirail | LED Bar Lighting System for Handrail


Sunday 26 May 2019

Colour a diagram with just four colours using a Python sat solver.

Take this simple diagram with regions marked 1 to 9. Given the rule that no two colours can touch edges (touching corners is ok), How can this diagram be coloured with just 4 colours ?
The first leap we take is to simplify the problem by translating spaces into dots and boundaries into lines.  This example diagram shows how any space can be represented by a dot and the boundaries between regions as a line. When each connected dot has a different colour, we have our answer. Using points and lines, rather than areas and boundaries simplifies the representation of the problem without changing the constraints of the problem.


(Diagram from wikipedia)

From the starting diagram give each region dot a number then join those dots where regions share a boundary. Each of these lines should only cross one region boundary between two neighbouring areas. This completes the translation from map to (non-directional) network graph.


We can list the boundary edges (yellow lines that join up dots) by using the start and finish region numbers.  For example region 1 has a boundary with region 2. This would be listed as ‘12’  and/or  ‘21’ depending which end was used as the starting point. 
Each point generates one joining line for each neighbour. The number of lines that comes from any point must equal the number of boundaries with neighbour regions.

These lines are listed here as two digits being the boundaries between each region, each row showing the lines from each point
12,13,15,19,
21,24,28,29,
31,34,36,35,
42,43,47,48
51,53,56,58,59,
67,63,65,
76,78,74,
82,84,85,87,89
91,92,95,98


PointIn contact withNumber of Vertex 
12,3,5,94
21,4,8,94
31,4,5,64
42,3,7,84
51,3,6,8,95
63,5,73
74,6,83
82,4,5,7,95
91,2,5,84
TOTAL
36 << Must be an even number as each line has two ends.
The Number of Vertex must equal the number of 0s in the matching row and column in the check matrix below.

This list could be easily simplified to remove duplicates ( 12 is effectively the same path as 21) by removing each entry where the second digit is smaller than the first.

Here is the list of colours to be used for the solution. 
Red
Blue
Green
Yellow
which are shortened to R,B,G,Y

This is where we have to take the next small jump and rephrase the connections into logical statements that describe the current graph situation in a way suitable for automatic solving. First we say each region must have one (but any) colour and then each region pair that touch must have different colours.

The rules are generated as :
  1. Every region can have any colour from the list of R,B,G,Y.
  2. Each region must have just one colour from the list R,B,G,Y.
  3. Regions that touch and share a border must have different colours

Generate rules for "Every region can have any colour from the list of R,B,G,Y".

This must be true ( region1=Red or region1=Blue ….… region1=Yellow ) AND ( region2=Red or … region2=Yellow) AND ( region9=Red or … region9=Yellow )

( 1R OR 1B OR 1G OR 1Y ) AND 
( 2R OR 2B OR 2G OR 2Y ) AND 
( 3R OR 3B OR 3G OR 3Y ) AND 
( 4R OR 4B OR 4G OR 4Y ) AND 
( 5R OR 5B OR 5G OR 5Y ) AND 
( 6R OR 6B OR 6G OR 6Y ) AND 
( 7R OR 7B OR 7G OR 7Y ) AND 
( 8R OR 8B OR 8G OR 8Y ) AND 
( 9R OR 9B OR 9G OR 9Y )

This perl snippet generates the lines for us.
$ perl -e ‘
for$i(1..9) { print("( ");
    for$j( R,B,G,Y)
        { print("$i$j"); print(" OR "if($jne'Y') };
          if($i!= 9) {print(" ) AND ") }elseprint(" )”);
        }
    print("\n”)
};

These phrases are reduced to a simpler form for the solver but the logic is the same. All the phrases in the generated list must be true.

$ perl -e 'for $i (1..9) { for $j ( R,B,G,Y) { print ("$i$j ") } print ("\n") }’ 

1R 1B 1G 1Y
2R 2B 2G 2Y 
3R 3B 3G 3Y 
4R 4B 4G 4Y 
5R 5B 5G 5Y 
6R 6B 6G 6Y 
7R 7B 7G 7Y 
8R 8B 8G 8Y 
9R 9B 9G 9Y 

Next we need to describe that each region should have only one colour using lots of this type of OR clause format that exclude a region from having two colours.  ~ stands for “Not" making ~R1 describe "Region 1 is not coloured Red"

~R1 OR ~B1

Simplified to 

~R1 ~B1

This statement can be interpreted as 
if  ( Region 1 is not red) or ( Region1 is not Blue) is true  
then 
    either Region 1 is not red and Region 1 is not blue  ( but could be any other colour)
    or       Region 1 is red and not blue (at the same time
    or       Region 1 is blue and not red (at the same time)

This mini statement or clause is created for all the regions across all the pairs of colours. 
There are 9 regions and four colours. 108 phrases that force each region to have just one colour. 

for$x(1..9) {
        for$i( R,B,G,Y) {
                for$j( R,B,G,Y)
                { nextif($ieq$j);
                  print("~$i$x~$j$x\n"unless$key{"$i$j$x"};
                  $key{"$i$j$x"}=1$key{"$j$i$x"}=1; # Memorise and exclude done pairs 
          }}}

# no more than one colour per region
~R1 ~B1
~R1 ~G1
~R1 ~Y1
~B1 ~G1
~B1 ~Y1
~G1 ~Y1
~R2 ~B2
~R2 ~G2
~R2 ~Y2
~B2 ~G2
~B2 ~Y2
~G2 ~Y2
…. and so on for the rest of the regions

Finally we need to state which regions are adjacent and must not have the same colour. Read these clauses as

if either of ( Region 1 is not red)  or ( Region2 is not Red) is true  
then 
    either Region 1 is not red in which case Region2 can be red
    or       Region 2 is not red in which case Region1 can be red

We list all the colours for all the regions that touch.
The full list of touching regions ( in both directions ) is listed but only use one direction for each pair. 

$rtt="12,13,15,19,21,24,28,29,31,34,35,36,42,43,47,48,51,53,56,58,59,63,65,67,74,76,78,82,84,85,87,89,91,92,95,98";
foreach$rsplit/,/,$rtt{
        ($a,$b) = split//,$r;
        for$j( R,B,G,Y) { 
                print("~$j$a~$j$b\n"unless$b$a
        }}

# Exclude each possible colour of each of the regions that touch
~R1 ~R2
~B1 ~B2
~G1 ~G2
~Y1 ~Y2
~R1 ~R3
~B1 ~B3
~G1 ~G3
~Y1 ~Y3
~R1 ~R5
~B1 ~B5
~G1 ~G5
… and so on for each touching pair

With all of the three sets of generated lines in a single solver input file 


$ python ../sat-master-Python/src/sat.py  < Allin_orig.txt
~R1 ~B1 ~G1 Y1~R2 ~B2 G2~Y2 ~R3 ~B3 G3~Y3 ~R4 B4~G4 ~Y4 ~R5B5~G5 ~Y5 ~R6 ~B6 ~G6 Y6~R7 ~B7 G7~Y7 ~R8 ~B8 ~G8 Y8 R9~B9 ~G9 ~Y9

Or in brief mode showing just the statements that are true.

$ python ../sat-master-Python/src/sat.py --brief  < Allin_orig.txt
Y1 G2 G3 B4 B5 Y6 G7 Y8 R9

1 Yellow
2 Green
3 Green
4 Blue
5 Blue
6 Yellow
7 Green
8 Yellow
9 Red

Which on the original daigram looks like this ..
Which is a correct 4 colour solution.

Alternative solutions can be found 

$ python ../sat-master-Python/src/sat.py  --brief --all < Allin_orig.txt| head
Y1 G2 G3 B4 B5 Y6 G7 Y8 R9
Y1 G2 G3 B4 B5 Y6 R7 Y8 R9
Y1 G2 G3 B4 B5 R6 G7 Y8 R9
Y1 G2 G3 B4 R5 Y6 G7 Y8 B9
Y1 G2 G3 B4 R5 Y6 R7 Y8 B9
Y1 G2 G3 B4 R5 B6 G7 Y8 B9
Y1 G2 G3 B4 R5 B6 R7 Y8 B9
Y1 G2 G3 R4 B5 Y6 G7 Y8 R9
Y1 G2 G3 R4 B5 Y6 B7 Y8 R9
Y1 G2 G3 R4 B5 R6 G7 Y8 R9

…..

Finally a double check using a contact table with proposed colours for the regions.
To Cross check using this table, Where there is a 0, the colour on the diagonal for the column and row must be different.

Cell colour table123456789
1Yellow00
0


0
20Green
0


00
30
Green000


4
00Blue

00
50
0
Blue0
00
6

0
0Yellow0

7


0
0Green0
8
0
00
0Yellow0
900

0

0Red


Making this test a little harder by changing the boundaries of regions 4 and 6. 
The current colouring is now incorrect as regions 3 & 2 are both Green and Regions 6 & 8 are both yellow.

The "regions that touch" list is extended to include

23
68

gives us an updated sat file with these lines added  

$ diff Allin_orig.txt  Allin_Better.txt
66a67,74
> ~R2 ~R3
> ~B2 ~B3
> ~G2 ~G3
> ~Y2 ~Y3
> ~R6 ~R8
> ~B6 ~B8
> ~G6 ~G8
> ~Y6 ~Y8

94a103,106  #These lines are moved down in the file but remain the same
> ~R3 ~R4
> ~B3 ~B4
> ~G3 ~G4
> ~Y3 ~Y4
103,106d114
< ~R3 ~R4
< ~B3 ~B4
< ~G3 ~G4
< ~Y3 ~Y4

Running the solver with the new input lines we get

$ python ../sat-master-Python/src/sat.py  --brief < Allin_Better.txt
Y1 G2 B3 Y4 G5 Y6 G7 B8 R9

1 Yellow
2 Green
3 Blue
4 Yellow
5 Green
6 Yellow
7 Green
8 Blue
9 Red

Which gives us a new colouring that works.

The above solution demonstrates a common simplification technique for turning an infinitely variable problem (any diagram, any number of subdivisions ) into simple logical statements that can be "satisfied" to generate a specific solution. 


Background Notes


Technique for map to graph translation. Put a blob in each area and join with a line to each neighbour blob. The letters on the blob indicate a common edge.

By Inductiveload - Based on a this raster image by chas zzz brown on en.wikipedia., CC BY-SA 3.0.


A set of regions of a map can be represented more abstractly as an undirected graph that has a vertex for each region and an edge for every pair of regions that share a boundary segment. This graph is planar (it is important to note that we are talking about the graphs that have some limitations according to the map they are transformed from only): it can be drawn in the plane without crossings by placing each vertex at an arbitrarily chosen location within the region to which it corresponds, and by drawing the edges as curves that lead without crossing within each region from the vertex location to each shared boundary point of the region. Conversely any planar graph can be formed from a map in this way. In graph-theoretic terminology, the four-color theorem states that the vertices of every planar graph can be colored with at most four colors so that no two adjacent vertices receive the same color, or for short, "every planar graph is four-colorable".[5]


code in swift to make the Sat lines
/*
#Enumuate the lines for a sat solver from a diagram
#in Swift
*/
let colours=["R","B","G","Y"]
print ("#Swift At least once colour for each region");
for in 1...9{
  for in colours {
     print ( "\(j)\(i)", terminator:"") }
   print ("") }

varkey=[String:Bool]()
print ("# no more than one colour per region");
for in1...9{
  for incolours {
    for incolours {
        if(i ==j) { continue}
            if key["\(i)\(j)\(x)"==nil
              {
                    print("~\(i)\(x)~\(j)\(x)")
                    key["\(i)\(j)\(x)"]=true
                    key["\(j)\(i)\(x)"]=true;
              }
    }}}

print ("# Exclude regions that touch");
/* #first set
rtt="12,13,15,19,21,24,28,29,31,34,35,36,42,43,47,48,51,53,56,58,59,63,65,67,74,76,78,82,84,85,87,89,91,92,95,98";
#add touching regions 23 & 68
*/
letrtt=[23,32,68,86,12,13,15,19,21,24,28,29,31,34,35,36,42,43,47,48,51,53,56,58,59,63,65,67,74,76,78,82,84,85,87,89,91,92,95,98];
forin rtt  {
  let a:Int  =/10
  let b:Int  =%10
  for in colours {
    if a<b {
       print ("~\(j)\(a)~\(j)\(b)")
}}}